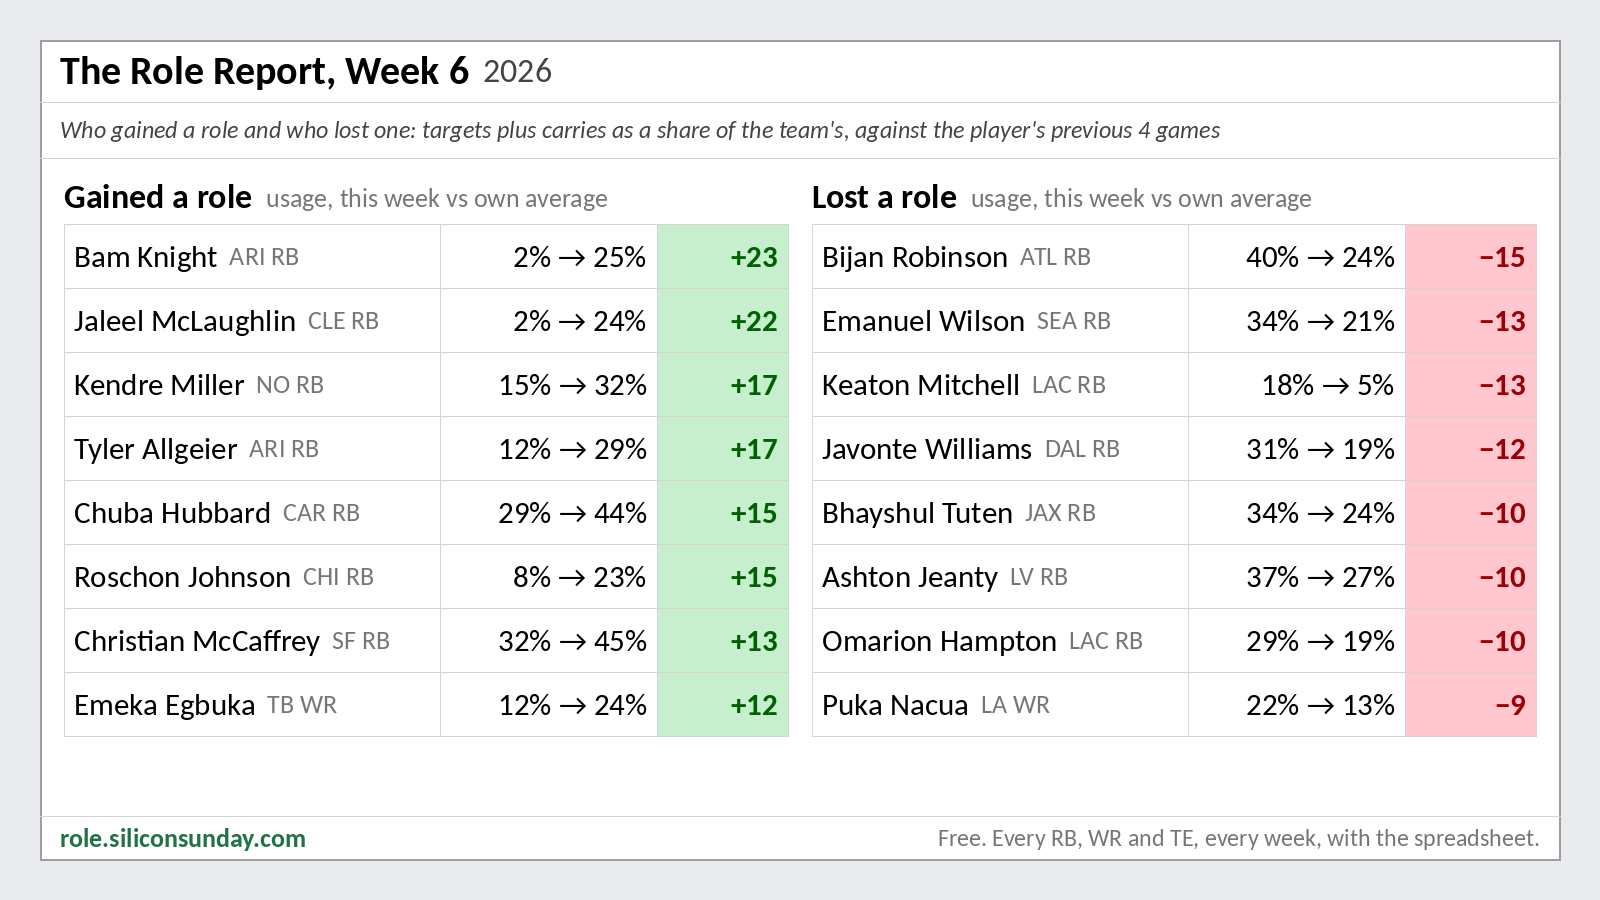
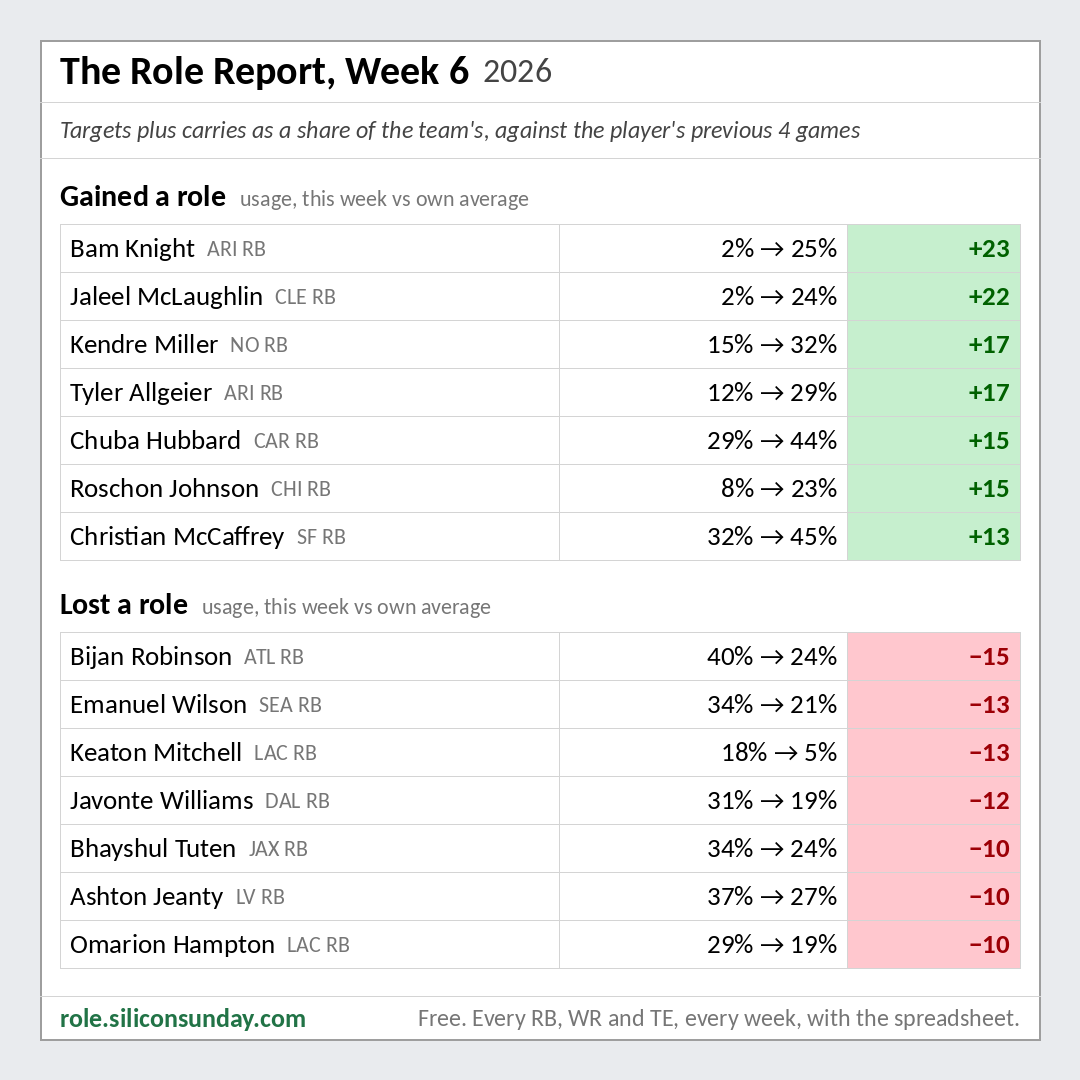
The Role Report, Week 6 2026
Sorted by team, then RB, WR, TE
AVG = previous 4 played weeks
INVL = (TGT + ATT) / Snaps
USG = (TGT + ATT) / (Tm TGT + Tm ATT)
DOM = (yards share + TD share) / 2
PPR % = share of team RB+WR+TE points
Player
OPPORTUNITY PRODUCTION RESULTS
Snaps Snap % TGT TGT % ATT ATT % INVL USG
DELTA
RuYd Ru % ReYd Re % AirYd Air % RACR WOPR TD TD % DOM
DELTA
PPR PPR % 0.5PPR 0.5PPR % STD STD %
DELTA
ARI vs LA
72 plays · 34 targets · 35 carries · 49% pass
RB Tyler AllgeierARI 40 56% 2 6% 18 51% 50% 29%
+17%
38 32% 10 5% -3 -2% – 0.08 0 – 7%
−1%
5.8 10% 5.3 12% 4.8 14%
0%
RB Bam KnightARI 32 44% 2 6% 15 43% 53% 25%
+23%
80 67% 18 8% 6 3% 3.00 0.11 0 – 14%
+12%
11.8 20% 10.8 24% 9.8 29%
+18%
WR Kendrick BourneARI 41 57% 8 24% 0 0% 20% 12%
+6%
0 0% 47 22% 31 17% 1.52 0.47 0 – 7%
+3%
9.7 17% 7.2 16% 4.7 14%
+10%
WR Michael WilsonARI 66 92% 7 21% 0 0% 11% 10%
−8%
0 0% 32 15% 86 47% 0.37 0.64 0 – 5%
−9%
7.2 12% 5.2 11% 3.2 10%
−6%
WR Jalen BrooksARI 38 53% 3 9% 0 0% 8% 4%
+1%
0 0% 30 14% 34 18% 0.88 0.26 0 – 4%
+4%
5.0 9% 4.0 9% 3.0 9%
+8%
WR Simi FehokoARI 6 8% 0 0% 0 0% 0% 0%
0%
0 0% 0 0% 0 0% – 0.00 0 – 0%
0%
0.0 0% 0.0 0% 0.0 0%
0%
WR Reggie VirgilARI 3 4% 0 0% 0 0% 0% 0%
−8%
0 0% 0 0% 0 0% – 0.00 0 – 0%
−4%
0.0 0% 0.0 0% 0.0 0%
−6%
TE Trey McBrideARI 70 97% 9 26% 0 0% 13% 13%
−5%
0 0% 53 24% 28 15% 1.89 0.50 0 – 8%
−18%
12.3 21% 8.8 19% 5.3 16%
−6%
TE Elijah HigginsARI 32 44% 3 9% 0 0% 9% 4%
+1%
0 0% 28 13% 2 1% 14.00 0.14 0 – 4%
−4%
5.8 10% 4.3 9% 2.8 8%
+2%
TE Teagan QuitorianoARI 30 42% 0 0% 0 0% 0% 0%
−3%
0 0% 0 0% 0 0% – 0.00 0 – 0%
−35%
0.0 0% 0.0 0% 0.0 0%
−19%
ATL vs CHI
55 plays · 33 targets · 12 carries · 73% pass
RB Bijan RobinsonATL 43 78% 2 6% 9 75% 26% 24%
−15%
61 97% -8 -4% -11 -3% – 0.07 0 0% 9%
−18%
7.3 10% 6.3 10% 5.3 10%
−19%
RB Brian RobinsonATL 10 18% 2 6% 2 17% 40% 9%
−10%
1 2% 9 4% 9 3% 1.00 0.11 0 0% 2%
−14%
3.0 4% 2.0 3% 1.0 2%
−11%
WR Drake LondonATL 55 100% 10 30% 0 0% 18% 22%
+9%
0 0% 62 28% 143 44% 0.43 0.76 0 0% 11%
−3%
12.2 18% 10.2 17% 8.2 16%
−6%
WR Jahan DotsonATL 47 85% 5 15% 0 0% 11% 11%
+5%
0 0% 87 39% 87 27% 1.00 0.41 1 33% 32%
+26%
17.7 25% 16.2 27% 14.7 29%
+17%
WR Olamide ZaccheausATL 30 55% 4 12% 0 0% 13% 9%
+6%
0 0% 0 0% 44 14% 0.00 0.28 0 0% 0%
0%
0.0 0% 0.0 0% 0.0 0%
−1%
WR Zachariah BranchATL 19 35% 2 6% 0 0% 11% 4%
+1%
0 0% 9 4% 9 3% 1.00 0.11 0 0% 2%
0%
4.9 7% 3.9 6% 2.9 6%
+3%
WR Chris BlairATL 2 4% 0 0% 0 0% 0% 0%
−1%
0 0% 0 0% 0 0% – 0.00 0 0% 0%
0%
0.0 0% 0.0 0% 0.0 0%
−1%
TE Kyle PittsATL 43 78% 7 21% 0 0% 16% 16%
+10%
0 0% 60 27% 39 12% 1.54 0.40 2 67% 44%
+28%
23.0 33% 20.5 34% 18.0 36%
+23%
TE Austin HooperATL 7 13% 1 3% 0 0% 14% 2%
−1%
0 0% 6 3% 5 2% 1.20 0.06 0 0% 1%
−3%
1.6 2% 1.1 2% 0.6 1%
−3%
TE Charlie WoernerATL 16 29% 0 0% 0 0% 0% 0%
−2%
0 0% 0 0% 0 0% – 0.00 0 0% 0%
0%
0.0 0% 0.0 0% 0.0 0%
−1%
TE Nick MuseATL 3 5% 0 0% 0 0% 0% 0%
0%
0 0% 0 0% 0 0% – 0.00 0 0% 0%
0%
0.0 0% 0.0 0% 0.0 0%
0%
BAL vs CLE
57 plays · 31 targets · 23 carries · 57% pass
RB Derrick HenryBAL 33 58% 1 3% 17 74% 55% 33%
−8%
58 67% 2 1% -3 -1% – 0.04 0 0% 12%
−21%
5.0 11% 4.5 13% 4.0 15%
−16%
RB Justice HillBAL 24 42% 3 10% 0 0% 12% 6%
−3%
0 0% 9 5% -12 -4% – 0.11 0 0% 2%
−3%
3.9 9% 2.4 7% 0.9 3%
+1%
WR Zay FlowersBAL 50 88% 11 35% 1 4% 24% 22%
+9%
1 1% 66 40% 106 39% 0.62 0.80 0 0% 13%
−6%
12.7 28% 9.7 27% 6.7 25%
+2%
WR Ja'Kobi LaneBAL 31 54% 5 16% 0 0% 16% 9%
+4%
0 0% 40 24% 56 21% 0.71 0.39 0 0% 8%
+7%
8.0 18% 6.0 17% 4.0 15%
+15%
WR Devontez WalkerBAL 37 65% 2 6% 0 0% 5% 4%
+1%
0 0% 0 0% 56 21% 0.00 0.24 0 0% 0%
−7%
0.0 0% 0.0 0% 0.0 0%
−6%
WR Rashod BatemanBAL 17 30% 1 3% 0 0% 6% 2%
−7%
0 0% 0 0% 10 4% 0.00 0.07 0 0% 0%
−14%
0.0 0% 0.0 0% 0.0 0%
−16%
WR LaJohntay WesterBAL 3 5% 0 0% 0 0% 0% 0%
−2%
0 0% 0 0% 0 0% – 0.00 0 0% 0%
−1%
0.0 0% 0.0 0% 0.0 0%
−2%
TE Josh CuevasBAL 23 40% 5 16% 0 0% 22% 9%
+8%
0 0% 44 27% 41 15% 1.07 0.35 1 100% 59%
+57%
14.4 32% 12.4 35% 10.4 39%
+29%
TE Mark AndrewsBAL 41 72% 3 10% 0 0% 7% 6%
−5%
0 0% 4 2% 19 7% 0.21 0.19 0 0% 1%
−8%
1.4 3% 0.9 3% 0.4 2%
−9%
TE Nick VannettBAL 23 40% 0 0% 0 0% 0% 0%
0%
0 0% 0 0% 0 0% – 0.00 0 0% 0%
0%
0.0 0% 0.0 0% 0.0 0%
0%
BUF vs LV
68 plays · 30 targets · 29 carries · 51% pass
RB James CookBUF 45 66% 3 10% 22 76% 56% 42%
+4%
95 92% 58 23% -8 -4% – 0.12 1 33% 38%
+6%
24.3 32% 22.8 35% 21.3 40%
+1%
RB Ty JohnsonBUF 12 18% 2 7% 1 3% 25% 5%
−2%
3 3% 24 9% 2 1% 12.00 0.11 0 0% 4%
−2%
4.7 6% 3.7 6% 2.7 5%
−7%
RB Ray DavisBUF 9 13% 1 3% 1 3% 22% 3%
+1%
4 4% 5 2% 2 1% 2.50 0.06 0 0% 1%
0%
1.9 2% 1.4 2% 0.9 2%
0%
WR Keon ColemanBUF 58 85% 6 20% 0 0% 10% 10%
+3%
0 0% 59 23% 88 48% 0.67 0.63 1 33% 25%
+10%
15.9 21% 13.9 21% 11.9 22%
+3%
WR Khalil ShakirBUF 41 60% 6 20% 0 0% 15% 10%
+1%
0 0% 34 13% 27 15% 1.26 0.40 1 33% 21%
+15%
13.4 17% 11.4 17% 9.4 18%
+5%
WR Josh PalmerBUF 17 25% 2 7% 0 0% 12% 3%
−1%
0 0% 37 15% 47 26% 0.79 0.28 0 0% 5%
−2%
4.7 6% 4.2 6% 3.7 7%
−1%
WR Skyler BellBUF 30 44% 1 3% 0 0% 3% 2%
−2%
0 0% 0 0% 16 9% 0.00 0.11 0 0% 0%
0%
0.0 0% 0.0 0% 0.0 0%
0%
TE Dalton KincaidBUF 49 72% 8 27% 0 0% 16% 14%
+7%
0 0% 38 15% 15 8% 2.53 0.46 0 0% 5%
−1%
10.8 14% 7.3 11% 3.8 7%
+3%
TE Dawson KnoxBUF 47 69% 1 3% 0 0% 2% 2%
−2%
0 0% 0 0% -5 -3% – 0.03 0 0% 0%
−3%
1.0 1% 0.5 1% 0.0 0%
−4%
TE Jackson HawesBUF 25 37% 0 0% 0 0% 0% 0%
0%
0 0% 0 0% 0 0% – 0.00 0 0% 0%
0%
0.0 0% 0.0 0% 0.0 0%
0%
TE Keleki LatuBUF 5 7% 0 0% 0 0% 0% 0%
0%
0 0% 0 0% 0 0% – 0.00 0 0% 0%
0%
0.0 0% 0.0 0% 0.0 0%
0%
CAR vs PHI
79 plays · 35 targets · 33 carries · 51% pass
RB Chuba HubbardCAR 74 94% 2 6% 28 85% 41% 44%
+15%
120 95% 1 0% -7 -2% – 0.07 1 33% 32%
+5%
19.1 24% 18.6 27% 18.1 31%
+1%
RB Trevor EtienneCAR 3 4% 0 0% 1 3% 33% 1%
-1 -1% 0 0% 0 0% – 0.00 0 0% 0%
-0.1 0% -0.1 0% -0.1 0%
RB Anthony Tyus IIICAR 2 3% 0 0% 0 0% 0% 0%
0%
0 0% 0 0% 0 0% – 0.00 0 0% 0%
0%
0.0 0% 0.0 0% 0.0 0%
0%
WR Jalen CokerCAR 59 75% 13 37% 0 0% 22% 19%
+6%
0 0% 97 35% 148 42% 0.66 0.85 0 0% 12%
−3%
15.7 20% 12.7 19% 9.7 17%
−1%
WR Tetairoa McMillanCAR 60 76% 9 26% 0 0% 15% 13%
−3%
0 0% 86 31% 103 29% 0.83 0.59 0 0% 11%
−7%
14.6 19% 11.6 17% 8.6 15%
−2%
WR John Metchie IIICAR 27 34% 3 9% 0 0% 11% 4%
−1%
0 0% 24 9% 28 8% 0.86 0.18 0 0% 3%
−16%
4.4 6% 3.4 5% 2.4 4%
−1%
WR David MooreCAR 2 3% 1 3% 0 0% 50% 1%
0%
0 0% 27 10% -1 0% – 0.04 0 0% 3%
+3%
3.7 5% 3.2 5% 2.7 5%
+5%
WR Brycen TremayneCAR 25 32% 0 0% 0 0% 0% 0%
−3%
0 0% 0 0% 0 0% – 0.00 0 0% 0%
−4%
0.0 0% 0.0 0% 0.0 0%
−6%
TE Tommy TrembleCAR 54 68% 4 11% 0 0% 7% 6%
0%
0 0% 46 16% 37 11% 1.24 0.25 2 67% 39%
+37%
20.6 26% 18.6 27% 16.6 29%
+21%
TE Mitchell EvansCAR 43 54% 1 3% 1 3% 5% 3%
0%
1 1% 0 0% 1 0% 0.00 0.04 0 0% 0%
−2%
0.1 0% 0.1 0% 0.1 0%
−4%
TE Darren WallerCAR 36 46% 2 6% 0 0% 6% 3%
−5%
0 0% 0 0% 43 12% 0.00 0.17 0 0% 0%
−13%
0.0 0% 0.0 0% 0.0 0%
−13%
TE Feleipe FranksCAR 4 5% 0 0% 0 0% 0% 0%
0%
0 0% 0 0% 0 0% – 0.00 0 0% 0%
0%
0.0 0% 0.0 0% 0.0 0%
0%
CHI vs ATL
77 plays · 33 targets · 33 carries · 50% pass
RB D'Andre SwiftCHI 45 58% 5 15% 16 48% 47% 32%
+4%
44 45% 26 9% 1 1% 26.00 0.23 2 50% 34%
+9%
23.0 25% 21.0 27% 19.0 31%
+4%
RB Roschon JohnsonCHI 31 40% 2 6% 13 39% 48% 23%
+15%
51 52% 34 11% 6 5% 5.67 0.13 1 25% 23%
+20%
14.5 16% 13.5 18% 12.5 20%
+9%
WR Luther Burden IIICHI 30 39% 8 24% 0 0% 27% 12%
−1%
0 0% 95 31% 46 38% 2.07 0.63 0 0% 12%
0%
17.5 19% 13.5 18% 9.5 15%
+1%
WR Rome OdunzeCHI 74 96% 4 12% 0 0% 5% 6%
−3%
0 0% 39 13% 38 32% 1.03 0.40 0 0% 5%
−2%
6.9 8% 5.4 7% 3.9 6%
−6%
WR Zavion ThomasCHI 10 13% 3 9% 0 0% 30% 5%
+3%
0 0% 25 8% 3 2% 8.33 0.15 0 0% 3%
+2%
5.5 6% 4.0 5% 2.5 4%
+4%
WR Kalif RaymondCHI 36 47% 2 6% 0 0% 6% 3%
−4%
0 0% 18 6% -3 -2% – 0.07 0 0% 2%
−7%
3.8 4% 2.8 4% 1.8 3%
−10%
WR Jahdae WalkerCHI 10 13% 0 0% 0 0% 0% 0%
0%
0 0% 0 0% 0 0% – 0.00 0 0% 0%
0%
0.0 0% 0.0 0% 0.0 0%
0%
TE Colston LovelandCHI 68 88% 7 21% 0 0% 10% 11%
+3%
0 0% 65 21% 33 28% 1.97 0.51 1 25% 21%
+17%
18.5 20% 15.5 20% 12.5 20%
+12%
TE Cole KmetCHI 57 74% 2 6% 0 0% 4% 3%
+1%
0 0% 3 1% -4 -3% – 0.07 0 0% 0%
0%
2.3 2% 1.3 2% 0.3 0%
+1%
TE Sam RoushCHI 24 31% 0 0% 0 0% 0% 0%
−2%
0 0% 0 0% 0 0% – 0.00 0 0% 0%
−1%
0.0 0% 0.0 0% 0.0 0%
−2%
CLE vs BAL
63 plays · 25 targets · 29 carries · 46% pass
RB Jaleel McLaughlinCLE 39 62% 4 16% 9 31% 33% 24%
+22%
41 44% 14 9% 1 0% 14.00 0.24 0 0% 11%
+5%
9.5 21% 7.5 20% 5.5 19%
+18%
RB Audric EstimeCLE 19 30% 0 0% 9 31% 47% 17%
19 20% 0 0% 0 0% – 0.00 1 100% 54%
7.9 18% 7.9 22% 7.9 28%
WR KC ConcepcionCLE 51 81% 6 24% 2 7% 16% 15%
+4%
2 2% 37 23% 55 26% 0.67 0.54 0 0% 8%
+4%
7.9 18% 5.9 16% 3.9 14%
+9%
WR Denzel BostonCLE 58 92% 5 20% 0 0% 9% 9%
−2%
0 0% 15 9% 87 41% 0.17 0.59 0 0% 3%
−27%
2.5 6% 2.0 5% 1.5 5%
−19%
WR Jerry JeudyCLE 39 62% 4 16% 0 0% 10% 7%
+3%
0 0% 69 42% 54 26% 1.28 0.42 0 0% 13%
+11%
10.9 24% 8.9 24% 6.9 24%
+19%
WR Tylan WallaceCLE 10 16% 1 4% 0 0% 10% 2%
+2%
0 0% 12 7% -1 0% – 0.06 0 0% 2%
+2%
2.2 5% 1.7 5% 1.2 4%
+5%
WR Malachi CorleyCLE 7 11% 0 0% 0 0% 0% 0%
0%
0 0% 0 0% 0 0% – 0.00 0 0% 0%
0%
0.0 0% 0.0 0% 0.0 0%
0%
WR Isaiah BondCLE 9 14% 0 0% 0 0% 0% 0%
−4%
0 0% 0 0% 0 0% – 0.00 0 0% 0%
−4%
0.0 0% 0.0 0% 0.0 0%
−7%
TE Harold Fannin Jr.CLE 56 89% 3 12% 0 0% 5% 6%
−5%
0 0% 9 5% 10 5% 0.90 0.21 0 0% 2%
−21%
1.9 4% 1.4 4% 0.9 3%
−16%
TE Blake WhiteheartCLE 17 27% 1 4% 0 0% 6% 2%
+1%
0 0% 8 5% 7 3% 1.14 0.08 0 0% 2%
−5%
1.8 4% 1.3 4% 0.8 3%
+1%
DAL vs GB
78 plays · 54 targets · 15 carries · 78% pass
RB Javonte WilliamsDAL 57 73% 2 4% 11 73% 23% 19%
−12%
41 85% 9 3% -10 -3% – 0.04 1 50% 33%
+4%
13.0 17% 12.0 20% 11.0 26%
−4%
RB Tyler GoodsonDAL 11 14% 3 6% 2 13% 45% 7%
+2%
0 0% 9 3% 4 1% 2.25 0.09 0 0% 1%
0%
1.9 3% 1.4 2% 0.9 2%
+1%
RB Hunter LuepkeDAL 11 14% 3 6% 0 0% 27% 4%
+3%
0 0% 9 3% 5 1% 1.80 0.09 0 0% 1%
+1%
3.9 5% 2.4 4% 0.9 2%
+4%
WR CeeDee LambDAL 69 88% 18 33% 0 0% 26% 26%
+9%
0 0% 70 27% 153 41% 0.46 0.79 0 0% 11%
−13%
16.0 21% 11.5 20% 7.0 17%
−7%
WR George PickensDAL 69 88% 11 20% 0 0% 16% 16%
+1%
0 0% 73 28% 115 31% 0.63 0.52 0 0% 12%
−5%
13.3 18% 10.3 17% 7.3 17%
−2%
WR Ryan FlournoyDAL 68 87% 9 17% 0 0% 13% 13%
+4%
0 0% 40 16% 52 14% 0.77 0.35 1 50% 32%
+26%
17.0 22% 13.5 23% 10.0 24%
+13%
WR Jonathan MingoDAL 15 19% 0 0% 0 0% 0% 0%
−3%
0 0% 0 0% 0 0% – 0.00 0 0% 0%
−1%
0.0 0% 0.0 0% 0.0 0%
−1%
TE Brevyn Spann-FordDAL 36 46% 5 9% 0 0% 14% 7%
+6%
0 0% 35 14% 31 8% 1.13 0.20 0 0% 6%
+5%
7.5 10% 5.5 9% 3.5 8%
+9%
TE Jake FergusonDAL 42 54% 3 6% 0 0% 7% 4%
−4%
0 0% 13 5% 23 6% 0.57 0.13 0 0% 2%
−12%
3.3 4% 2.3 4% 1.3 3%
−7%
TE Luke SchoonmakerDAL 9 12% 0 0% 0 0% 0% 0%
−1%
0 0% 0 0% 0 0% – 0.00 0 0% 0%
−1%
0.0 0% 0.0 0% 0.0 0%
−1%
DEN vs SEA
60 plays · 24 targets · 28 carries · 46% pass
RB J.K. DobbinsDEN 31 52% 3 12% 17 61% 65% 38%
+10%
41 55% 5 5% -10 -10% – 0.12 1 50% 38%
+22%
13.6 29% 12.1 32% 10.6 35%
+14%
RB RJ HarveyDEN 24 40% 4 17% 6 21% 42% 19%
+2%
25 34% 31 29% -20 -21% – 0.11 1 50% 40%
+31%
14.6 31% 13.1 34% 11.6 39%
+14%
RB Tyler BadieDEN 4 7% 0 0% 1 4% 25% 2%
−3%
6 8% 0 0% 0 0% – 0.00 0 0% 2%
−2%
0.6 1% 0.6 2% 0.6 2%
−5%
WR Jaylen WaddleDEN 39 65% 7 29% 0 0% 18% 13%
0%
0 0% 24 22% 49 51% 0.49 0.79 0 0% 7%
−14%
6.4 14% 4.4 11% 2.4 8%
−5%
WR Marvin Mims Jr.DEN 16 27% 4 17% 0 0% 25% 8%
+4%
0 0% 13 12% 39 40% 0.33 0.53 0 0% 4%
+2%
3.3 7% 2.3 6% 1.3 4%
+4%
WR Courtland SuttonDEN 46 77% 3 12% 0 0% 7% 6%
−3%
0 0% 19 18% 30 31% 0.63 0.40 0 0% 5%
−5%
3.9 8% 2.9 8% 1.9 6%
−2%
WR Troy FranklinDEN 31 52% 1 4% 0 0% 3% 2%
0%
0 0% 2 2% 1 1% 2.00 0.07 0 0% 1%
−2%
1.2 3% 0.7 2% 0.2 1%
−2%
WR Lil'Jordan HumphreyDEN 17 28% 0 0% 0 0% 0% 0%
−3%
0 0% 0 0% 0 0% – 0.00 0 0% 0%
−1%
0.0 0% 0.0 0% 0.0 0%
−2%
TE Evan EngramDEN 31 52% 2 8% 0 0% 6% 4%
−2%
0 0% 13 12% 8 8% 1.62 0.18 0 0% 4%
0%
3.3 7% 2.3 6% 1.3 4%
+1%
TE Adam TrautmanDEN 33 55% 0 0% 0 0% 0% 0%
0%
0 0% 0 0% 0 0% – 0.00 0 0% 0%
0%
0.0 0% 0.0 0% 0.0 0%
0%
TE Nate AdkinsDEN 22 37% 0 0% 0 0% 0% 0%
−3%
0 0% 0 0% 0 0% – 0.00 0 0% 0%
−12%
0.0 0% 0.0 0% 0.0 0%
−8%
GB vs DAL
75 plays · 40 targets · 26 carries · 61% pass
RB Pierre StrongGB 41 55% 6 15% 11 42% 41% 26%
+10%
28 49% 39 14% 7 2% 5.57 0.24 0 0% 10%
+8%
11.7 19% 9.2 19% 6.7 18%
+14%
RB MarShawn LloydGB 30 40% 1 2% 8 31% 30% 14%
−4%
10 18% 0 0% -6 -2% – 0.03 0 0% 2%
−16%
1.0 2% 1.0 2% 1.0 3%
−13%
RB Kaleb JohnsonGB 4 5% 0 0% 1 4% 25% 2%
−12%
-2 -4% 0 0% 0 0% – 0.00 0 0% 0%
−5%
-0.2 0% -0.2 0% -0.2 -1%
−5%
WR Matthew GoldenGB 63 84% 13 32% 0 0% 21% 20%
+5%
0 0% 104 38% 203 52% 0.51 0.85 1 50% 41%
+16%
22.4 37% 19.4 39% 16.4 43%
+14%
WR Christian WatsonGB 66 88% 8 20% 0 0% 12% 12%
−3%
0 0% 64 23% 145 37% 0.44 0.56 0 0% 10%
−21%
9.4 15% 7.9 16% 6.4 17%
−12%
WR Savion WilliamsGB 40 53% 4 10% 2 8% 15% 9%
9 16% 32 12% 8 2% 4.00 0.16 0 0% 6%
8.1 13% 6.1 12% 4.1 11%
WR J. Michael SturdivantGB 4 5% 0 0% 0 0% 0% 0%
−2%
0 0% 0 0% 0 0% – 0.00 0 0% 0%
−1%
0.0 0% 0.0 0% 0.0 0%
−2%
WR Bo MeltonGB 18 24% 0 0% 0 0% 0% 0%
−3%
0 0% 0 0% 0 0% – 0.00 0 0% 0%
−1%
0.0 0% 0.0 0% 0.0 0%
−1%
TE Tucker KraftGB 58 77% 8 20% 0 0% 14% 12%
+1%
0 0% 37 13% 32 8% 1.16 0.36 0 0% 6%
−6%
8.7 14% 6.2 13% 3.7 10%
0%
TE Jonnu SmithGB 9 12% 0 0% 0 0% 0% 0%
−2%
0 0% 0 0% 0 0% – 0.00 0 0% 0%
−1%
0.0 0% 0.0 0% 0.0 0%
−2%
TE Josh WhyleGB 17 23% 0 0% 0 0% 0% 0%
0%
0 0% 0 0% 0 0% – 0.00 0 0% 0%
0%
0.0 0% 0.0 0% 0.0 0%
0%
TE Mark RedmanGB 25 33% 0 0% 0 0% 0% 0%
−1%
0 0% 0 0% 0 0% – 0.00 0 0% 0%
−1%
0.0 0% 0.0 0% 0.0 0%
−2%
HOU vs JAX
63 plays · 32 targets · 25 carries · 56% pass
RB Woody MarksHOU 49 78% 3 9% 15 60% 37% 32%
+11%
56 49% 25 8% 7 3% 3.57 0.16 0 0% 10%
−7%
10.1 11% 9.1 12% 8.1 12%
−4%
RB Jawhar JordanHOU 14 22% 1 3% 6 24% 50% 12%
43 38% 7 2% 6 2% 1.17 0.06 1 25% 18%
12.0 13% 11.5 15% 11.0 17%
WR Nico CollinsHOU 46 73% 5 16% 1 4% 13% 11%
−5%
5 4% 74 24% 73 28% 1.01 0.43 0 0% 9%
−17%
10.9 12% 9.4 12% 7.9 12%
−14%
WR Jaylin NoelHOU 31 49% 4 12% 0 0% 13% 7%
−2%
0 0% 107 34% 61 24% 1.75 0.35 1 25% 25%
+12%
20.7 23% 18.7 24% 16.7 25%
+9%
WR Marvin Harrison Jr.HOU 12 19% 4 12% 0 0% 33% 7%
+2%
0 0% 34 11% 49 19% 0.69 0.32 0 0% 4%
−3%
6.4 7% 4.9 6% 3.4 5%
+1%
WR Kayshon BoutteHOU 26 41% 3 9% 0 0% 12% 5%
−2%
0 0% 16 5% 21 8% 0.76 0.20 0 0% 2%
−3%
3.6 4% 2.6 3% 1.6 2%
−5%
WR Xavier HutchinsonHOU 34 54% 3 9% 0 0% 9% 5%
−7%
0 0% 10 3% 14 5% 0.71 0.18 0 0% 1%
−7%
3.0 3% 2.0 3% 1.0 2%
−10%
TE Dalton SchultzHOU 25 40% 6 19% 0 0% 24% 11%
+1%
0 0% 33 11% 24 9% 1.38 0.35 0 0% 4%
−3%
7.3 8% 5.3 7% 3.3 5%
−8%
TE Cade StoverHOU 13 21% 0 0% 2 8% 15% 4%
+3%
5 4% 0 0% 0 0% – 0.00 0 0% 1%
0%
0.5 1% 0.5 1% 0.5 1%
0%
TE Foster MoreauHOU 39 62% 2 6% 0 0% 5% 4%
−1%
0 0% 7 2% 7 3% 1.00 0.11 2 50% 26%
+18%
14.7 16% 13.7 18% 12.7 19%
+9%
TE Brevin JordanHOU 5 8% 1 3% 0 0% 20% 2%
+1%
0 0% -1 0% -4 -2% – 0.04 0 0% 0%
−1%
0.9 1% 0.4 1% -0.1 0%
0%
IND vs TEN
83 plays · 38 targets · 30 carries · 56% pass
RB Jonathan TaylorIND 65 78% 4 11% 21 70% 38% 37%
−2%
94 57% 57 21% -1 0% – 0.16 1 50% 42%
+10%
21.1 29% 20.1 33% 19.1 38%
+1%
RB Seth McGowanIND 19 23% 0 0% 4 13% 21% 6%
−2%
27 16% 0 0% 0 0% – 0.00 0 0% 3%
0%
2.7 4% 2.7 4% 2.7 5%
0%
WR Keenan AllenIND 59 71% 11 29% 0 0% 19% 16%
+4%
0 0% 82 30% 104 28% 0.79 0.63 0 0% 9%
−9%
16.2 22% 12.2 20% 8.2 16%
+7%
WR Josh DownsIND 71 86% 8 21% 1 3% 13% 13%
+2%
7 4% 40 15% 75 20% 0.53 0.46 0 0% 5%
−3%
8.7 12% 6.7 11% 4.7 9%
−3%
WR Laquon TreadwellIND 77 93% 5 13% 0 0% 6% 7%
0%
0 0% 21 8% 69 19% 0.30 0.33 0 0% 2%
−4%
4.1 6% 3.1 5% 2.1 4%
−5%
WR Deion BurksIND 15 18% 2 5% 1 3% 20% 4%
+2%
7 4% 41 15% 33 9% 1.24 0.14 0 0% 6%
+5%
6.8 9% 5.8 9% 4.8 10%
+8%
WR Anthony GouldIND 1 1% 0 0% 0 0% 0% 0%
0 0% 0 0% 0 0% – 0.00 0 0% 0%
0.0 0% 0.0 0% 0.0 0%
TE Will MalloryIND 43 52% 6 16% 0 0% 14% 9%
0 0% 20 7% 87 24% 0.23 0.40 0 0% 2%
4.0 6% 3.0 5% 2.0 4%
TE Pharaoh BrownIND 4 5% 1 3% 0 0% 25% 1%
0 0% 7 3% -1 0% – 0.04 0 0% 1%
1.7 2% 1.2 2% 0.7 1%
TE Mo Alie-CoxIND 31 37% 1 3% 0 0% 3% 1%
0%
0 0% 1 0% 1 0% 1.00 0.04 1 50% 25%
+24%
7.1 10% 6.6 11% 6.1 12%
+7%
TE Andrew OgletreeIND 30 36% 0 0% 0 0% 0% 0%
−1%
0 0% 0 0% 0 0% – 0.00 0 0% 0%
0%
0.0 0% 0.0 0% 0.0 0%
−1%
JAX vs HOU
71 plays · 41 targets · 27 carries · 60% pass
RB Bhayshul TutenJAX 41 58% 4 10% 12 44% 39% 24%
−10%
39 37% 48 16% -13 -3% – 0.12 2 50% 36%
+8%
24.7 34% 22.7 36% 20.7 40%
+14%
RB Chris Rodriguez Jr.JAX 21 30% 1 2% 11 41% 57% 18%
+7%
55 52% 0 0% 2 1% 0.00 0.04 0 0% 7%
−6%
5.5 8% 5.5 9% 5.5 11%
−1%
RB LeQuint Allen Jr.JAX 8 11% 0 0% 1 4% 12% 1%
−1%
1 1% 0 0% 0 0% – 0.00 0 0% 0%
0%
0.1 0% 0.1 0% 0.1 0%
−1%
WR Parker WashingtonJAX 52 73% 11 27% 0 0% 21% 16%
+3%
0 0% 64 21% 153 41% 0.42 0.69 0 0% 8%
−17%
10.4 14% 8.4 14% 6.4 12%
−9%
WR Jakobi MeyersJAX 53 75% 10 24% 0 0% 19% 15%
+8%
0 0% 83 27% 117 31% 0.71 0.58 0 0% 10%
+2%
13.3 18% 10.8 17% 8.3 16%
+6%
WR Brian Thomas Jr.JAX 15 21% 2 5% 0 0% 13% 3%
−3%
0 0% 0 0% 34 9% 0.00 0.14 0 0% 0%
−9%
0.0 0% 0.0 0% 0.0 0%
−8%
WR Travis HunterJAX 9 13% 0 0% 0 0% 0% 0%
0%
0 0% 0 0% 0 0% – 0.00 0 0% 0%
0%
0.0 0% 0.0 0% 0.0 0%
0%
WR Josh CameronJAX 36 51% 0 0% 0 0% 0% 0%
−4%
0 0% 0 0% 0 0% – 0.00 0 0% 0%
−6%
0.0 0% 0.0 0% 0.0 0%
−7%
TE Brenton StrangeJAX 54 76% 7 17% 0 0% 13% 10%
0%
0 0% 44 14% 56 15% 0.79 0.36 0 0% 5%
−2%
9.4 13% 6.9 11% 4.4 8%
−2%
TE Nate BoerkircherJAX 39 55% 2 5% 0 0% 5% 3%
+1%
0 0% 8 3% 5 1% 1.60 0.08 1 25% 13%
+12%
8.8 12% 7.8 13% 6.8 13%
+10%
TE Tanner KoziolJAX 11 15% 0 0% 0 0% 0% 0%
0%
0 0% 0 0% 0 0% – 0.00 0 0% 0%
0%
0.0 0% 0.0 0% 0.0 0%
0%
TE Quintin MorrisJAX 9 13% 0 0% 0 0% 0% 0%
0%
0 0% 0 0% 0 0% – 0.00 0 0% 0%
0%
0.0 0% 0.0 0% 0.0 0%
−1%
KC vs LAC
61 plays · 29 targets · 27 carries · 52% pass
RB Kenneth Walker IIIKC 45 74% 3 10% 19 70% 49% 39%
−5%
128 85% 11 4% -10 -8% – 0.10 2 100% 66%
+27%
27.9 37% 26.9 42% 25.9 49%
+2%
RB Emmett JohnsonKC 18 30% 3 10% 3 11% 33% 11%
+2%
6 4% 18 7% -7 -6% – 0.11 0 0% 3%
−1%
4.4 6% 3.4 5% 2.4 5%
0%
WR Xavier WorthyKC 51 84% 7 24% 0 0% 14% 12%
+3%
0 0% 73 27% 30 25% 2.43 0.54 0 0% 9%
0%
14.3 19% 10.8 17% 7.3 14%
+9%
WR Jalen RoyalsKC 45 74% 4 14% 0 0% 9% 7%
+4%
0 0% 24 9% 19 16% 1.26 0.32 0 0% 3%
−3%
4.4 6% 3.4 5% 2.4 5%
+2%
WR Andrew ArmstrongKC 42 69% 2 7% 0 0% 5% 4%
0 0% 13 5% 14 12% 0.93 0.19 0 0% 2%
2.3 3% 1.8 3% 1.3 2%
WR Cyrus AllenKC 9 15% 2 7% 0 0% 22% 4%
+3%
0 0% 27 10% 20 17% 1.35 0.22 0 0% 3%
+3%
4.7 6% 3.7 6% 2.7 5%
+6%
WR Justin WatsonKC 1 2% 0 0% 0 0% 0% 0%
0 0% 0 0% 0 0% – 0.00 0 0% 0%
0.0 0% 0.0 0% 0.0 0%
WR Nikko RemigioKC 2 3% 0 0% 0 0% 0% 0%
0 0% 0 0% 0 0% – 0.00 0 0% 0%
0.0 0% 0.0 0% 0.0 0%
TE Travis KelceKC 40 66% 5 17% 0 0% 12% 9%
0%
0 0% 53 19% 36 30% 1.47 0.47 0 0% 6%
−9%
9.3 12% 7.3 11% 5.3 10%
−3%
TE Noah GrayKC 39 64% 3 10% 0 0% 8% 5%
+2%
0 0% 53 19% 17 14% 3.12 0.26 0 0% 6%
+4%
8.3 11% 6.8 11% 5.3 10%
+7%
TE Jake BriningstoolKC 10 16% 0 0% 0 0% 0% 0%
−1%
0 0% 0 0% 0 0% – 0.00 0 0% 0%
0%
0.0 0% 0.0 0% 0.0 0%
−1%
LA vs ARI
58 plays · 32 targets · 20 carries · 62% pass
RB Kyren WilliamsLA 42 72% 6 19% 10 50% 38% 31%
0%
50 54% 17 8% 3 2% 5.67 0.29 0 0% 11%
−16%
9.7 15% 8.2 15% 6.7 16%
−10%
RB Blake CorumLA 16 28% 2 6% 9 45% 69% 21%
+7%
42 46% 18 8% -3 -2% – 0.08 1 50% 35%
+27%
14.0 21% 13.0 24% 12.0 29%
+13%
WR Puka NacuaLA 52 90% 7 22% 0 0% 13% 13%
−9%
0 0% 80 36% 60 39% 1.33 0.60 0 0% 13%
−11%
14.0 21% 11.0 20% 8.0 19%
−8%
WR Davante AdamsLA 43 74% 4 12% 0 0% 9% 8%
−6%
0 0% 39 18% 54 35% 0.72 0.43 0 0% 6%
−16%
6.9 10% 5.4 10% 3.9 9%
−13%
WR Konata MumpfieldLA 27 47% 3 9% 0 0% 11% 6%
+1%
0 0% 15 7% 1 1% 15.00 0.15 0 0% 2%
−7%
3.5 5% 2.5 5% 1.5 4%
−1%
WR Jordan WhittingtonLA 8 14% 0 0% 0 0% 0% 0%
−1%
0 0% 0 0% 0 0% – 0.00 0 0% 0%
0%
0.0 0% 0.0 0% 0.0 0%
−1%
TE Colby ParkinsonLA 36 62% 6 19% 0 0% 17% 12%
+9%
0 0% 31 14% 23 15% 1.35 0.39 1 50% 30%
+29%
14.1 21% 11.6 22% 9.1 22%
+19%
TE Tyler HigbeeLA 48 83% 4 12% 0 0% 8% 8%
0%
0 0% 22 10% 17 11% 1.29 0.26 0 0% 4%
−9%
4.2 6% 2.2 4% 0.2 0%
−5%
TE Davis AllenLA 18 31% 0 0% 1 5% 6% 2%
−1%
0 0% 0 0% 0 0% – 0.00 0 0% 0%
−1%
0.0 0% 0.0 0% 0.0 0%
−2%
LAC vs KC
68 plays · 36 targets · 22 carries · 62% pass
RB Kimani VidalLAC 25 37% 4 11% 7 32% 44% 19%
+10%
21 29% 19 9% -1 -1% – 0.16 0 – 7%
−10%
7.0 16% 5.5 16% 4.0 17%
+3%
RB Omarion HamptonLAC 34 50% 4 11% 7 32% 32% 19%
−10%
18 25% 21 10% -4 -2% – 0.15 0 – 7%
−16%
7.9 18% 5.9 17% 3.9 17%
−1%
RB Keaton MitchellLAC 17 25% 1 3% 2 9% 18% 5%
−13%
4 5% 0 0% -6 -3% – 0.02 0 – 1%
−19%
0.4 1% 0.4 1% 0.4 2%
−16%
WR KeAndre Lambert-SmithLAC 59 87% 9 25% 0 0% 15% 16%
0 0% 32 16% 69 35% 0.46 0.62 0 – 6%
6.2 14% 3.7 11% 1.2 5%
WR Quentin JohnstonLAC 56 82% 3 8% 0 0% 5% 5%
−4%
0 0% 57 28% 70 35% 0.81 0.37 0 – 10%
+6%
6.7 15% 6.2 18% 5.7 25%
+7%
WR Theo Wease Jr.LAC 32 47% 3 8% 0 0% 9% 5%
+3%
0 0% 21 10% 20 10% 1.05 0.20 0 – 4%
+1%
4.1 9% 3.1 9% 2.1 9%
+3%
WR Ladd McConkeyLAC 8 12% 1 3% 0 0% 12% 2%
−6%
0 0% 17 8% 10 5% 1.70 0.08 0 – 3%
−10%
2.7 6% 2.2 6% 1.7 7%
−11%
WR Derius DavisLAC 5 7% 0 0% 1 5% 20% 2%
+1%
4 5% 0 0% 0 0% – 0.00 0 – 1%
0%
0.4 1% 0.4 1% 0.4 2%
0%
TE Charlie KolarLAC 45 66% 6 17% 0 0% 13% 10%
+6%
0 0% 20 10% 18 9% 1.11 0.31 0 – 4%
0%
5.0 11% 3.5 10% 2.0 9%
+5%
TE Oronde Gadsden IILAC 33 49% 5 14% 0 0% 15% 9%
+3%
0 0% 17 8% 22 11% 0.77 0.29 0 – 3%
−5%
4.7 10% 3.2 9% 1.7 7%
+2%
TE Hayden RucciLAC 9 13% 0 0% 0 0% 0% 0%
−1%
0 0% 0 0% 0 0% – 0.00 0 – 0%
−9%
0.0 0% 0.0 0% 0.0 0%
−6%
LV vs BUF
66 plays · 39 targets · 20 carries · 66% pass
RB Ashton JeantyLV 38 58% 6 15% 10 50% 42% 27%
−10%
22 34% 36 12% 19 6% 1.89 0.27 1 33% 24%
+12%
15.8 20% 13.8 21% 11.8 21%
+3%
RB Mike Washington Jr.LV 23 35% 1 3% 9 45% 43% 17%
+8%
43 66% 7 2% 1 0% 7.00 0.04 0 0% 7%
0%
6.0 8% 5.5 8% 5.0 9%
+2%
RB Dylan LaubeLV 5 8% 1 3% 1 5% 40% 3%
0%
0 0% -1 0% -1 0% – 0.04 0 0% 0%
−7%
0.9 1% 0.4 1% -0.1 0%
−3%
WR Tre TuckerLV 46 70% 7 18% 0 0% 15% 12%
+1%
0 0% 97 31% 108 31% 0.90 0.49 2 67% 46%
+33%
26.7 34% 24.2 36% 21.7 39%
+18%
WR Jalen NailorLV 42 64% 4 10% 0 0% 10% 7%
+2%
0 0% 9 3% 53 15% 0.17 0.26 0 0% 1%
−1%
1.9 2% 1.4 2% 0.9 2%
−1%
WR Cody WhiteLV 14 21% 2 5% 0 0% 14% 3%
−2%
0 0% 0 0% 13 4% 0.00 0.10 0 0% 0%
−15%
0.0 0% 0.0 0% 0.0 0%
−13%
WR Dareke YoungLV 6 9% 0 0% 0 0% 0% 0%
−1%
0 0% 0 0% 0 0% – 0.00 0 0% 0%
−1%
0.0 0% 0.0 0% 0.0 0%
−2%
WR Malik BensonLV 8 12% 0 0% 0 0% 0% 0%
−3%
0 0% 0 0% 0 0% – 0.00 0 0% 0%
0%
0.0 0% 0.0 0% 0.0 0%
−1%
TE Michael MayerLV 52 79% 9 23% 0 0% 17% 15%
+8%
0 0% 95 30% 35 10% 2.71 0.42 0 0% 13%
+5%
16.5 21% 13.0 19% 9.5 17%
+10%
TE Brock BowersLV 65 98% 9 23% 0 0% 14% 15%
−3%
0 0% 70 22% 115 34% 0.61 0.58 0 0% 9%
−26%
11.0 14% 9.0 13% 7.0 13%
−17%
TE Ian ThomasLV 14 21% 0 0% 0 0% 0% 0%
−2%
0 0% 0 0% 0 0% – 0.00 0 0% 0%
−8%
0.0 0% 0.0 0% 0.0 0%
−5%
NE vs NYJ
68 plays · 30 targets · 36 carries · 45% pass
RB Rhamondre StevensonNE 41 60% 0 0% 14 39% 34% 21%
0%
36 24% 0 0% 0 0% – 0.00 0 0% 5%
−8%
3.6 5% 3.6 6% 3.6 7%
−10%
RB Corey KinerNE 12 18% 0 0% 11 31% 92% 17%
+10%
57 39% 0 0% 0 0% – 0.00 0 0% 7%
+5%
5.7 8% 5.7 10% 5.7 11%
+5%
RB TreVeyon HendersonNE 16 24% 1 3% 7 19% 50% 12%
−8%
31 21% 9 4% 3 1% 3.00 0.06 0 0% 5%
−13%
3.0 4% 2.5 4% 2.0 4%
−7%
WR A.J. BrownNE 52 76% 10 33% 0 0% 19% 15%
+9%
0 0% 27 11% 99 37% 0.27 0.76 0 0% 4%
−1%
5.7 8% 4.2 7% 2.7 5%
−2%
WR DeMario DouglasNE 40 59% 8 27% 0 0% 20% 12%
+6%
0 0% 86 37% 71 27% 1.21 0.59 1 33% 28%
+20%
19.6 29% 16.1 27% 12.6 25%
+19%
WR Romeo DoubsNE 2 3% 1 3% 0 0% 50% 2%
−7%
0 0% 42 18% 42 16% 1.00 0.16 1 33% 22%
+8%
11.2 16% 10.7 18% 10.2 20%
−1%
WR Efton Chism IIINE 42 62% 1 3% 0 0% 2% 2%
−4%
0 0% 0 0% 5 2% 0.00 0.06 0 0% 0%
−6%
0.0 0% 0.0 0% 0.0 0%
−7%
WR Kyle WilliamsNE 25 37% 1 3% 0 0% 4% 2%
−3%
0 0% 12 5% 12 5% 1.00 0.08 0 0% 2%
−4%
2.2 3% 1.7 3% 1.2 2%
−4%
TE Hunter HenryNE 52 76% 5 17% 0 0% 10% 8%
+1%
0 0% 48 20% 13 5% 3.69 0.28 1 33% 23%
+16%
14.8 22% 12.8 22% 10.8 22%
+11%
TE Eli RaridonNE 39 57% 3 10% 0 0% 8% 5%
+1%
0 0% 11 5% 20 8% 0.55 0.20 0 0% 1%
−14%
2.1 3% 1.6 3% 1.1 2%
−5%
TE Cameron LatuNE 18 26% 0 0% 0 0% 0% 0%
0%
0 0% 0 0% 0 0% – 0.00 0 0% 0%
0%
0.0 0% 0.0 0% 0.0 0%
0%
NO vs NYG
72 plays · 30 targets · 38 carries · 44% pass
RB Kendre MillerNO 32 44% 2 7% 20 53% 69% 32%
+17%
70 40% 0 0% -8 -4% – 0.07 0 0% 11%
−9%
9.0 15% 8.0 15% 7.0 16%
+5%
RB Alvin KamaraNO 19 26% 4 13% 7 18% 58% 16%
−2%
34 19% 35 24% 13 7% 2.69 0.25 1 25% 23%
+10%
14.9 25% 13.9 26% 12.9 29%
+11%
RB CJ DonaldsonNO 24 33% 1 3% 6 16% 29% 10%
+5%
39 22% 0 0% -5 -3% – 0.03 0 0% 6%
+3%
1.9 3% 1.9 4% 1.9 4%
0%
WR Chris OlaveNO 42 58% 7 23% 0 0% 17% 10%
−7%
0 0% 43 30% 53 29% 0.81 0.55 1 25% 19%
−2%
14.3 24% 12.3 23% 10.3 23%
−3%
WR Devaughn VeleNO 66 92% 6 20% 0 0% 9% 9%
−3%
0 0% 42 29% 88 48% 0.48 0.63 0 0% 7%
−5%
7.2 12% 5.7 11% 4.2 9%
−4%
WR Bryce LanceNO 36 50% 4 13% 0 0% 11% 6%
+1%
0 0% 9 6% 25 14% 0.36 0.30 1 25% 14%
+13%
8.9 15% 7.9 15% 6.9 15%
+13%
WR Barion BrownNO 19 26% 1 3% 0 0% 5% 1%
+1%
0 0% 5 3% 4 2% 1.25 0.07 0 0% 1%
+1%
1.5 2% 1.0 2% 0.5 1%
+3%
WR Cedric TillmanNO 4 6% 0 0% 0 0% 0% 0%
0%
0 0% 0 0% 0 0% – 0.00 0 0% 0%
0%
0.0 0% 0.0 0% 0.0 0%
0%
TE Oscar DelpNO 31 43% 2 7% 0 0% 6% 3%
+3%
0 0% 10 7% 3 2% 3.33 0.11 0 0% 2%
+1%
3.0 5% 2.0 4% 1.0 2%
+4%
TE Juwan JohnsonNO 42 58% 2 7% 0 0% 5% 3%
−8%
0 0% 0 0% 10 5% 0.00 0.14 0 0% 0%
−14%
0.0 0% 0.0 0% 0.0 0%
−18%
TE Noah FantNO 42 58% 1 3% 0 0% 2% 1%
−3%
0 0% 0 0% 1 1% 0.00 0.05 0 0% 0%
−12%
0.0 0% 0.0 0% 0.0 0%
−10%
TE Treyton WelchNO 3 4% 0 0% 0 0% 0% 0%
−1%
0 0% 0 0% 0 0% – 0.00 0 0% 0%
0%
0.0 0% 0.0 0% 0.0 0%
0%
NYG vs NO
77 plays · 43 targets · 20 carries · 68% pass
RB Tyrone Tracy Jr.NYG 29 38% 3 7% 6 30% 31% 14%
+12%
18 21% 27 7% 5 1% 5.40 0.11 2 67% 38%
+37%
18.5 21% 17.5 23% 16.5 25%
+19%
RB Devin SingletaryNYG 31 40% 1 2% 4 20% 16% 8%
−3%
14 17% 19 5% -6 -1% – 0.03 0 0% 3%
−6%
4.3 5% 3.8 5% 3.3 5%
−5%
RB Najee HarrisNYG 11 14% 0 0% 4 20% 36% 6%
−6%
2 2% 0 0% 0 0% – 0.00 0 0% 0%
−4%
0.2 0% 0.2 0% 0.2 0%
−5%
RB Cam SkatteboNYG 6 8% 0 0% 0 0% 0% 0%
−32%
0 0% 0 0% 0 0% – 0.00 0 0% 0%
−13%
0.0 0% 0.0 0% 0.0 0%
−21%
WR Malik NabersNYG 66 86% 15 35% 0 0% 23% 24%
+10%
0 0% 165 42% 145 34% 1.14 0.76 0 0% 17%
0%
28.5 32% 22.5 29% 16.5 25%
+9%
WR Malachi FieldsNYG 72 94% 8 19% 0 0% 11% 13%
+7%
0 0% 19 5% 60 14% 0.32 0.38 0 0% 2%
−8%
3.9 4% 2.9 4% 1.9 3%
−8%
WR Darnell MooneyNYG 28 36% 2 5% 1 5% 11% 5%
−2%
20 24% 0 0% 26 6% 0.00 0.11 0 0% 2%
−3%
2.0 2% 2.0 3% 2.0 3%
−7%
WR Charlie JonesNYG 20 26% 3 7% 0 0% 15% 5%
+5%
0 0% 66 17% 71 17% 0.93 0.22 0 0% 7%
+7%
8.6 10% 7.6 10% 6.6 10%
+10%
TE Isaiah LikelyNYG 70 91% 11 26% 0 0% 16% 17%
+1%
0 0% 99 25% 128 30% 0.77 0.59 1 33% 27%
+11%
23.9 27% 20.9 27% 17.9 28%
+4%
TE Thomas Fidone IINYG 29 38% 0 0% 0 0% 0% 0%
0 0% 0 0% 0 0% – 0.00 0 0% 0%
0.0 0% 0.0 0% 0.0 0%
TE Chris ManhertzNYG 12 16% 0 0% 0 0% 0% 0%
0%
0 0% 0 0% 0 0% – 0.00 0 0% 0%
0%
0.0 0% 0.0 0% 0.0 0%
0%
NYJ vs NE
62 plays · 29 targets · 27 carries · 52% pass
RB Braelon AllenNYJ 54 87% 2 7% 17 63% 35% 34%
+3%
78 80% 26 10% 3 1% 8.67 0.11 0 0% 15%
−8%
12.4 20% 11.4 22% 10.4 25%
+1%
RB Isaiah DavisNYJ 8 13% 1 3% 7 26% 100% 14%
+11%
16 16% 10 4% -5 -2% – 0.04 0 0% 4%
+2%
3.6 6% 3.1 6% 2.6 6%
+4%
WR Omar Cooper Jr.NYJ 51 82% 7 24% 0 0% 14% 12%
+11%
0 0% 103 41% 89 35% 1.16 0.61 1 100% 65%
+61%
22.3 37% 19.3 38% 16.3 40%
+31%
WR Garrett WilsonNYJ 61 98% 6 21% 0 0% 10% 11%
−6%
0 0% 44 17% 56 22% 0.79 0.47 0 0% 6%
−22%
8.4 14% 6.4 13% 4.4 11%
−15%
WR Tim PatrickNYJ 43 69% 3 10% 0 0% 7% 5%
0%
0 0% 15 6% 16 6% 0.94 0.20 0 0% 2%
−2%
2.5 4% 2.0 4% 1.5 4%
−4%
WR Isaiah WilliamsNYJ 9 15% 0 0% 1 4% 11% 2%
−6%
4 4% 0 0% 0 0% – 0.00 0 0% 1%
−20%
0.4 1% 0.4 1% 0.4 1%
−17%
TE Mason TaylorNYJ 34 55% 6 21% 0 0% 18% 11%
+7%
0 0% 33 13% 61 24% 0.54 0.48 0 0% 5%
+4%
7.3 12% 5.3 10% 3.3 8%
+8%
TE Kenyon SadiqNYJ 22 35% 3 10% 0 0% 14% 5%
−4%
0 0% 12 5% 34 13% 0.35 0.25 0 0% 2%
−7%
2.2 4% 1.7 3% 1.2 3%
−5%
TE Jelani WoodsNYJ 13 21% 1 3% 0 0% 8% 2%
0%
0 0% 9 4% -1 0% – 0.05 0 0% 1%
0%
1.9 3% 1.4 3% 0.9 2%
+1%
TE Jeremy RuckertNYJ 14 23% 0 0% 0 0% 0% 0%
−3%
0 0% 0 0% 0 0% – 0.00 0 0% 0%
−6%
0.0 0% 0.0 0% 0.0 0%
−5%
PHI vs CAR
64 plays · 44 targets · 13 carries · 77% pass
RB Dameon PiercePHI 61 95% 5 11% 12 92% 28% 30%
+1%
35 100% 15 7% 2 1% 7.50 0.17 1 50% 35%
+33%
15.0 24% 13.0 26% 11.0 30%
+18%
RB Carson SteelePHI 3 5% 2 5% 0 0% 67% 4%
0 0% 4 2% -2 -1% – 0.06 0 0% 1%
1.4 2% 0.9 2% 0.4 1%
WR DeVonta SmithPHI 42 66% 14 32% 0 0% 33% 25%
+8%
0 0% 75 35% 179 49% 0.42 0.82 1 50% 40%
+22%
20.5 33% 17.0 34% 13.5 36%
+5%
WR Makai LemonPHI 52 81% 6 14% 0 0% 12% 11%
+1%
0 0% 19 9% 32 9% 0.59 0.27 0 0% 4%
−2%
4.9 8% 3.4 7% 1.9 5%
−4%
WR Dontayvion WicksPHI 40 62% 4 9% 0 0% 10% 7%
−4%
0 0% 24 11% 61 17% 0.39 0.25 0 0% 5%
−4%
4.4 7% 3.4 7% 2.4 6%
−8%
WR Darius CooperPHI 39 61% 2 5% 0 0% 5% 4%
−2%
0 0% 9 4% 21 6% 0.43 0.11 0 0% 2%
−28%
1.9 3% 1.4 3% 0.9 2%
−18%
WR Elijah MoorePHI 8 12% 2 5% 0 0% 25% 4%
+4%
0 0% 4 2% 12 3% 0.33 0.09 0 0% 1%
+1%
1.4 2% 0.9 2% 0.4 1%
+2%
TE Dallas GoedertPHI 52 81% 8 18% 0 0% 15% 14%
+4%
0 0% 61 28% 54 15% 1.13 0.38 0 0% 12%
−6%
12.1 19% 9.1 18% 6.1 16%
0%
TE Johnny MundtPHI 19 30% 1 2% 0 0% 5% 2%
0%
0 0% 4 2% 4 1% 1.00 0.04 0 0% 1%
0%
1.4 2% 0.9 2% 0.4 1%
0%
TE E.J. JenkinsPHI 4 6% 0 0% 0 0% 0% 0%
0%
0 0% 0 0% 0 0% – 0.00 0 0% 0%
0%
0.0 0% 0.0 0% 0.0 0%
0%
PIT vs TB
79 plays · 44 targets · 22 carries · 67% pass
RB Jaylen WarrenPIT 59 75% 4 9% 14 64% 31% 27%
−9%
50 56% 28 11% 4 2% 7.00 0.15 0 0% 11%
−14%
9.8 12% 8.8 14% 7.8 17%
−15%
RB Rico DowdlePIT 21 27% 4 9% 7 32% 52% 17%
−2%
40 45% 9 4% -11 -6% – 0.09 0 0% 7%
+1%
7.9 10% 6.4 10% 4.9 11%
0%
WR DK MetcalfPIT 75 95% 15 34% 0 0% 20% 23%
+10%
0 0% 93 37% 118 69% 0.79 0.99 0 0% 14%
+3%
20.3 26% 14.8 24% 9.3 20%
+12%
WR Germie BernardPIT 74 94% 12 27% 0 0% 16% 18%
+9%
0 0% 87 34% 21 12% 4.14 0.49 1 50% 38%
+32%
25.7 32% 20.2 32% 14.7 32%
+23%
WR Brandon JohnsonPIT 3 4% 0 0% 0 0% 0% 0%
0 0% 0 0% 0 0% – 0.00 0 0% 0%
0.0 0% 0.0 0% 0.0 0%
WR Brandon SmithPIT 41 52% 0 0% 0 0% 0% 0%
0%
0 0% 0 0% 0 0% – 0.00 0 0% 0%
0%
0.0 0% 0.0 0% 0.0 0%
0%
TE Darnell WashingtonPIT 56 71% 6 14% 0 0% 11% 9%
+3%
0 0% 25 10% 25 15% 1.00 0.31 1 50% 29%
+21%
12.5 16% 10.5 17% 8.5 18%
+7%
TE Pat FreiermuthPIT 57 72% 3 7% 0 0% 5% 5%
−6%
0 0% 11 4% 15 9% 0.73 0.16 0 0% 2%
−13%
3.1 4% 2.1 3% 1.1 2%
−11%
TE Robert TonyanPIT 8 10% 0 0% 0 0% 0% 0%
0%
0 0% 0 0% 0 0% – 0.00 0 0% 0%
0%
0.0 0% 0.0 0% 0.0 0%
0%
SEA vs DEN
85 plays · 46 targets · 26 carries · 64% pass
RB Emanuel WilsonSEA 27 32% 1 2% 14 54% 56% 21%
−13%
52 46% 0 0% -4 -1% – 0.03 0 0% 7%
−17%
5.2 7% 5.2 9% 5.2 12%
−12%
RB George HolaniSEA 49 58% 0 0% 5 19% 10% 7%
−6%
20 18% 0 0% 0 0% – 0.00 1 100% 53%
+48%
8.0 11% 8.0 14% 8.0 19%
+4%
RB Velus Jones Jr.SEA 9 11% 1 2% 4 15% 56% 7%
+7%
20 18% -1 0% -6 -1% – 0.02 0 0% 2%
+2%
2.9 4% 2.4 4% 1.9 4%
+4%
RB Brady RussellSEA 2 2% 0 0% 0 0% 0% 0%
−1%
0 0% 0 0% 0 0% – 0.00 0 0% 0%
−1%
0.0 0% 0.0 0% 0.0 0%
−3%
WR Jaxon Smith-NjigbaSEA 78 92% 16 35% 0 0% 21% 22%
+5%
0 0% 134 48% 183 43% 0.73 0.83 0 0% 17%
−22%
25.4 36% 19.4 34% 13.4 31%
−1%
WR Cooper KuppSEA 72 85% 10 22% 0 0% 14% 14%
+9%
0 0% 50 18% 77 18% 0.65 0.45 0 0% 6%
0%
10.0 14% 7.5 13% 5.0 12%
+7%
WR Rashid ShaheedSEA 39 46% 8 17% 1 4% 23% 12%
+4%
2 2% 66 24% 129 31% 0.51 0.48 0 0% 9%
+1%
11.8 17% 9.3 16% 6.8 16%
+7%
WR Tory HortonSEA 39 46% 5 11% 0 0% 13% 7%
+5%
0 0% 13 5% 28 7% 0.46 0.21 0 0% 2%
−3%
2.3 3% 1.8 3% 1.3 3%
−2%
TE AJ BarnerSEA 79 93% 4 9% 0 0% 5% 6%
−3%
0 0% 16 6% 17 4% 0.94 0.16 0 0% 2%
−5%
4.6 7% 3.1 5% 1.6 4%
−2%
TE Eric SaubertSEA 16 19% 1 2% 0 0% 6% 1%
0%
0 0% 0 0% -3 -1% – 0.03 0 0% 0%
−3%
0.0 0% 0.0 0% 0.0 0%
−2%
TE Nick KallerupSEA 10 12% 0 0% 0 0% 0% 0%
0%
0 0% 0 0% 0 0% – 0.00 0 0% 0%
0%
0.0 0% 0.0 0% 0.0 0%
0%
TE Elijah ArroyoSEA 5 6% 0 0% 0 0% 0% 0%
−1%
0 0% 0 0% 0 0% – 0.00 0 0% 0%
−1%
0.0 0% 0.0 0% 0.0 0%
−1%
SF vs WAS
62 plays · 29 targets · 29 carries · 50% pass
RB Christian McCaffreySF 53 85% 10 34% 16 55% 49% 45%
+13%
64 51% 53 20% 17 7% 3.12 0.56 2 67% 48%
+21%
30.7 43% 26.2 43% 21.7 42%
+16%
RB Kaelon BlackSF 14 23% 1 3% 8 28% 64% 16%
+4%
34 27% 3 1% -1 0% – 0.05 0 0% 5%
+2%
4.7 7% 4.2 7% 3.7 7%
+4%
WR Mike EvansSF 25 40% 5 17% 0 0% 20% 9%
−4%
0 0% 94 36% 99 39% 0.95 0.53 0 0% 12%
−5%
12.4 17% 10.9 18% 9.4 18%
−4%
WR Brandin CooksSF 32 52% 2 7% 0 0% 6% 3%
+1%
0 0% 13 5% 13 5% 1.00 0.14 0 0% 2%
−7%
2.3 3% 1.8 3% 1.3 3%
−3%
WR Jordan WatkinsSF 47 76% 1 3% 0 0% 2% 2%
0%
0 0% 22 8% 16 6% 1.38 0.10 0 0% 3%
+1%
3.2 4% 2.7 4% 2.2 4%
+1%
WR Malik TurnerSF 3 5% 0 0% 0 0% 0% 0%
0 0% 0 0% 0 0% – 0.00 0 0% 0%
0.0 0% 0.0 0% 0.0 0%
WR Jacob CowingSF 15 24% 0 0% 0 0% 0% 0%
−3%
0 0% 0 0% 0 0% – 0.00 0 0% 0%
0%
0.0 0% 0.0 0% 0.0 0%
−1%
TE George KittleSF 55 89% 8 28% 0 0% 15% 14%
+3%
0 0% 69 26% 75 30% 0.92 0.62 1 33% 26%
+5%
17.9 25% 15.4 25% 12.9 25%
+2%
TE Brayden WillisSF 1 2% 0 0% 0 0% 0% 0%
0%
0 0% 0 0% 0 0% – 0.00 0 0% 0%
0%
0.0 0% 0.0 0% 0.0 0%
0%
TE Luke FarrellSF 30 48% 0 0% 0 0% 0% 0%
−1%
0 0% 0 0% 0 0% – 0.00 0 0% 0%
0%
0.0 0% 0.0 0% 0.0 0%
0%
TB vs PIT
74 plays · 41 targets · 25 carries · 62% pass
RB Bucky IrvingTB 63 85% 3 7% 19 76% 35% 33%
−1%
46 45% 3 2% -9 -3% – 0.09 0 0% 9%
−13%
6.9 14% 5.9 15% 4.9 17%
−9%
RB Kenny GainwellTB 11 15% 1 2% 2 8% 27% 5%
−7%
17 17% 7 4% -6 -2% – 0.02 0 0% 5%
−5%
3.4 7% 2.9 7% 2.4 8%
−4%
WR Emeka EgbukaTB 64 86% 16 39% 0 0% 25% 24%
+12%
0 0% 48 29% 136 50% 0.35 0.94 1 100% 59%
+37%
17.8 36% 14.3 36% 10.8 37%
+18%
WR Chris Godwin Jr.TB 68 92% 8 20% 0 0% 12% 12%
+4%
0 0% 37 23% 54 20% 0.69 0.43 0 0% 7%
+1%
7.7 15% 5.7 14% 3.7 13%
+2%
WR Ted Hurst IIITB 37 50% 6 15% 0 0% 16% 9%
+3%
0 0% 40 24% 78 29% 0.51 0.42 0 0% 8%
−9%
7.0 14% 5.5 14% 4.0 14%
+4%
WR Tez JohnsonTB 25 34% 3 7% 0 0% 12% 5%
0%
0 0% 7 4% 6 2% 1.17 0.13 0 0% 1%
−4%
2.7 5% 1.7 4% 0.7 2%
−3%
TE Cade OttonTB 74 100% 2 5% 0 0% 3% 3%
−6%
0 0% 4 2% -4 -1% – 0.06 0 0% 1%
−6%
1.4 3% 0.9 2% 0.4 1%
−11%
TE Bauer SharpTB 4 5% 1 2% 0 0% 25% 2%
+2%
0 0% 21 13% 21 8% 1.00 0.09 0 0% 4%
+4%
3.1 6% 2.6 7% 2.1 7%
+6%
TE Payne DurhamTB 24 32% 0 0% 0 0% 0% 0%
−1%
0 0% 0 0% 0 0% – 0.00 0 0% 0%
0%
0.0 0% 0.0 0% 0.0 0%
0%
TEN vs IND
46 plays · 22 targets · 23 carries · 49% pass
RB Tony PollardTEN 35 76% 1 5% 19 83% 57% 44%
+11%
76 90% 0 0% -7 -5% – 0.03 0 0% 20%
+2%
7.6 22% 7.6 26% 7.6 32%
+3%
RB Tyjae SpearsTEN 11 24% 1 5% 1 4% 18% 4%
−8%
1 1% 7 7% -4 -3% – 0.05 0 0% 2%
−3%
1.8 5% 1.3 4% 0.8 3%
−7%
WR Carnell TateTEN 34 74% 7 32% 0 0% 21% 16%
+1%
0 0% 70 69% 87 65% 0.80 0.93 1 100% 69%
+59%
19.0 54% 16.0 54% 13.0 54%
+36%
WR Wan'Dale RobinsonTEN 27 59% 7 32% 0 0% 26% 16%
+4%
0 0% 22 22% 37 28% 0.59 0.67 0 0% 6%
−20%
5.2 15% 3.7 13% 2.2 9%
−6%
WR Calvin RidleyTEN 28 61% 2 9% 0 0% 7% 4%
+1%
0 0% 0 0% 9 7% 0.00 0.18 0 0% 0%
−4%
0.0 0% 0.0 0% 0.0 0%
−7%
WR Elic AyomanorTEN 28 61% 2 9% 0 0% 7% 4%
0%
0 0% 3 3% 9 7% 0.33 0.18 0 0% 1%
−4%
1.3 4% 0.8 3% 0.3 1%
−5%
WR Chimere DikeTEN 8 17% 0 0% 0 0% 0% 0%
−3%
0 0% 0 0% 0 0% – 0.00 0 0% 0%
−2%
0.0 0% 0.0 0% 0.0 0%
−5%
TE Daniel BellingerTEN 22 48% 2 9% 0 0% 9% 4%
+2%
0 0% 0 0% 3 2% 0.00 0.15 0 0% 0%
−1%
0.0 0% 0.0 0% 0.0 0%
−3%
TE David Martin-RobinsonTEN 4 9% 0 0% 0 0% 0% 0%
0%
0 0% 0 0% 0 0% – 0.00 0 0% 0%
0%
0.0 0% 0.0 0% 0.0 0%
0%
TE Gunnar HelmTEN 33 72% 0 0% 0 0% 0% 0%
−4%
0 0% 0 0% 0 0% – 0.00 0 0% 0%
−1%
0.0 0% 0.0 0% 0.0 0%
−5%
WAS vs SF
67 plays · 35 targets · 17 carries · 67% pass
RB Rachaad WhiteWAS 46 69% 5 14% 7 41% 26% 23%
+7%
27 51% 30 10% 7 3% 4.29 0.23 1 50% 33%
+23%
15.7 21% 13.7 23% 11.7 25%
+8%
RB Jeremy McNicholsWAS 12 18% 0 0% 5 29% 42% 10%
13 25% 0 0% 0 0% – 0.00 0 0% 2%
1.3 2% 1.3 2% 1.3 3%
RB Austin EkelerWAS 7 10% 2 6% 1 6% 43% 6%
−3%
3 6% 4 1% -10 -4% – 0.06 0 0% 1%
−3%
2.7 4% 1.7 3% 0.7 2%
−4%
WR Stefon DiggsWAS 41 61% 7 20% 0 0% 17% 13%
+1%
0 0% 44 15% 39 15% 1.13 0.40 1 50% 31%
+8%
16.4 22% 13.4 22% 10.4 22%
0%
WR Treylon BurksWAS 37 55% 6 17% 0 0% 16% 12%
+7%
0 0% 66 22% 75 28% 0.88 0.45 0 0% 9%
−11%
10.6 14% 8.6 14% 6.6 14%
+2%
WR Antonio WilliamsWAS 45 67% 4 11% 0 0% 9% 8%
0%
0 0% 50 17% 66 25% 0.76 0.34 0 0% 7%
+4%
8.0 11% 6.5 11% 5.0 11%
+2%
WR Dyami BrownWAS 33 49% 1 3% 0 0% 3% 2%
−3%
0 0% 6 2% 4 1% 1.50 0.05 0 0% 1%
−2%
1.6 2% 1.1 2% 0.6 1%
−5%
WR Terry McLaurinWAS 7 10% 1 3% 0 0% 14% 2%
−9%
0 0% 27 9% 23 9% 1.17 0.10 0 0% 4%
−8%
3.7 5% 3.2 5% 2.7 6%
−13%
WR Luke McCaffreyWAS 8 12% 1 3% 0 0% 12% 2%
0 0% 0 0% 27 10% 0.00 0.11 0 0% 0%
0.0 0% 0.0 0% 0.0 0%
TE Chig OkonkwoWAS 51 76% 7 20% 0 0% 14% 13%
+6%
0 0% 69 23% 35 13% 1.97 0.39 0 0% 10%
+6%
13.9 18% 10.4 17% 6.9 15%
+9%
TE John BatesWAS 25 37% 1 3% 0 0% 4% 2%
+1%
0 0% 4 1% 1 0% 4.00 0.05 0 0% 1%
0%
1.4 2% 0.9 1% 0.4 1%
+1%
TE Ben SinnottWAS 18 27% 0 0% 0 0% 0% 0%
−1%
0 0% 0 0% 0 0% – 0.00 0 0% 0%
0%
0.0 0% 0.0 0% 0.0 0%
−1%
TE Colson YankoffWAS 5 7% 0 0% 0 0% 0% 0%
−2%
0 0% 0 0% 0 0% – 0.00 0 0% 0%
−1%
0.0 0% 0.0 0% 0.0 0%
−1%
League average, week 6
Mean of every player at the position who took a snap.
Pos Snap % TGT % ATT % USG DOM PPR % RB 40% 6% 33% 18% 14% 12% WR 50% 12% 0% 7% 8% 10% TE 44% 7% 0% 4% 5% 6%